This graph illustrates the increasing levels of carbon dioxide emitted throughout time. The graph also shows the increase in emissions of different countries.
Time vs. Carbon Dioxide Emitted

Time vs. Carbon Dioxide Level
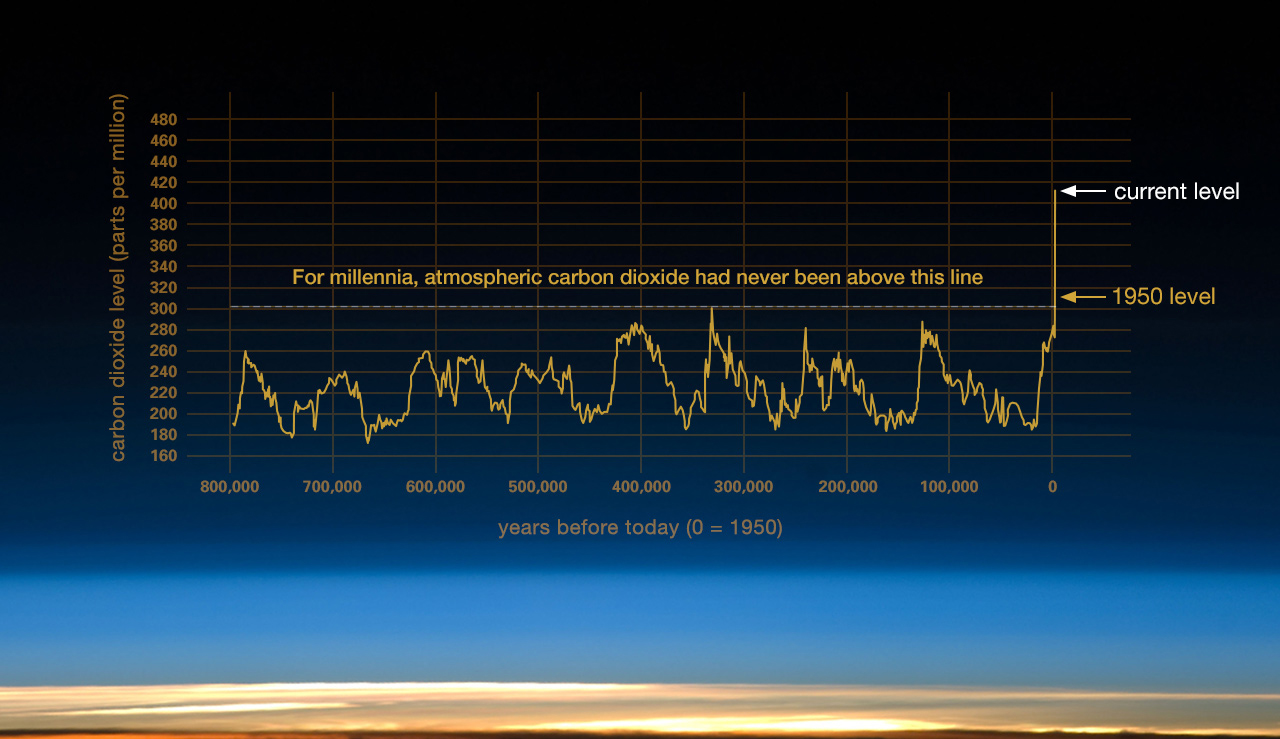
This graph shows the huge increase in carbon dioxide levels that has occurred recently. There has been a huge increase in recent years.
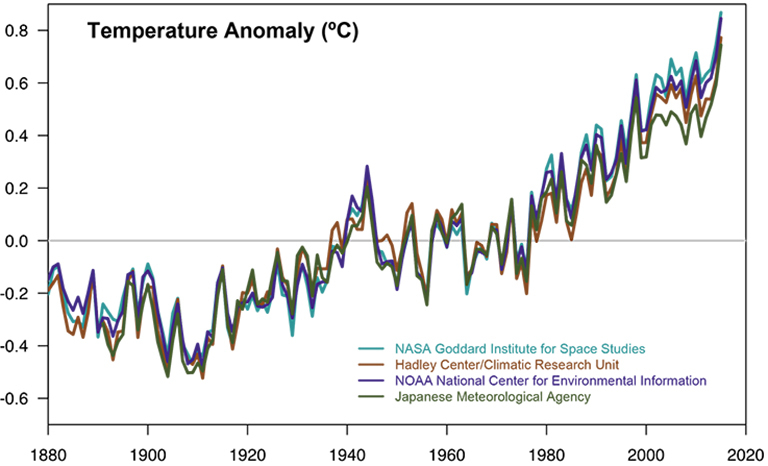
This graph shows the positive trend in temperature anomaly that has occurred recently due to global warming.
Time vs. Temperature Anomaly
Works Cited
"Climate Change: How Do We Know?" NASA, climate.nasa.gov/evidence/. Accessed 29 July 2020.
Gonchar, Michael. "Teach About Climate Change With These 24 New York Times Graphs." The New York Times, 28 Feb. 2019, www.nytimes.com/2019/02/28/learning/teach-about-climate-change-with-these-24-new-york-times-graphs.html. Accessed 29 July 2020.
Williams, Martin. "Climate change in ten graphs." 4 News, 1 June 2017, www.channel4.com/news/factcheck/climate-change-in-ten-graphs. Accessed 29 July 2020.